
Ever wonder what drives someone to use (or not use) a mobile app?
Or what type of mobile app they’re likely to use the most?
Or how much time they’re spending in the mobile apps they download?
Good news…
In this post, we’ve gathered 28 of the most up-to-date mobile app usage and download stats, facts and projections you can use to make sure your own app aligns with what your target audience is actually doing in 2020 and beyond.
We’ve pulled research from the likes of App Annie, Statista, Sensor Tower, Mary Meeker and more to bring you the numbers and insights that matter most.
Let’s get right to it (or skip to a section below).
Mobile App Usage & Download Statistics
Millennials & Gen Z App Usage Statistics
Mobile App Revenue Statistics
Mobile App Usage & Download Statistics
We kick things off with stats about usage trends and download habits. These numbers highlight what’s going on in the mobile app market today and even speak to the psychology of mobile users.
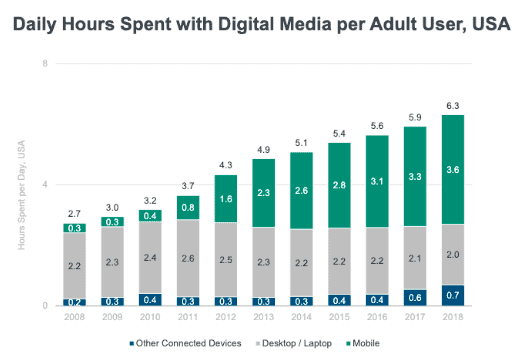
1. Mobile internet usage is rising while desktop internet usage continues to fall. (Mary Meeker)
According to the 2019 Mary Meeker report, the number of hours spent on the internet continues to increase every year, but the split between desktop and mobile is becoming more and more pronounced. In 2018, Americans were spending 3.6 hours per day on mobile (12 times more than a decade prior) and just 2 hours per day on a desktop or laptop (which has stayed pretty consistent since 2008).
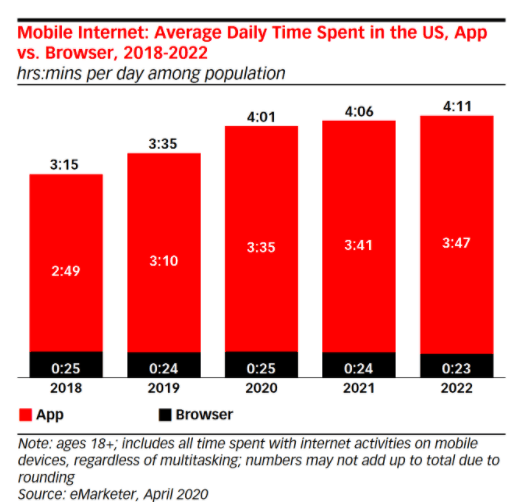
2. Nearly 90% of mobile internet time is spent in apps. (eMarketer)
The gap between mobile app usage and mobile browser usage is also widening. In 2020, eMarketer predicts that adult smartphone users will spend about 4 hours per day using mobile internet, and 88% of that time will be spent in mobile apps, rather than a browser. This speaks to the importance of companies not only optimizing their websites for mobile, but creating custom, responsive apps too.
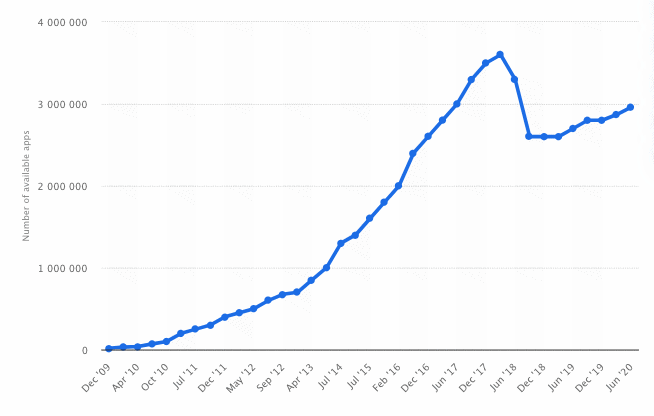
3. There are currently more than 2.9 million apps available in the Google Play Store. (Statista)
As of June 2020, there were 2.96 million apps published in the Google Play Store. While the Android operating system leads the pack for market share globally, it’s interesting to learn that competition is much lighter here than in the Apple App Store (see next statistic).
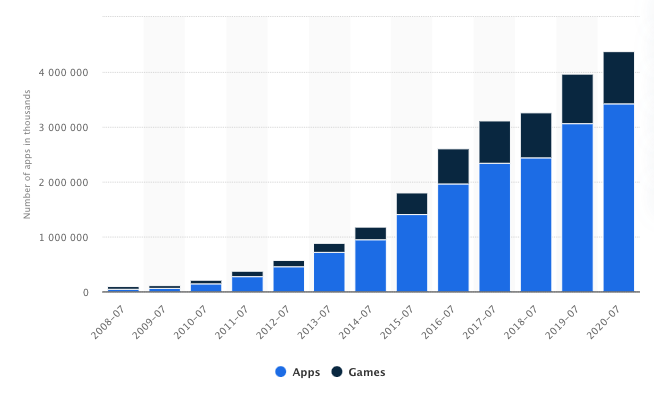
4. There are nearly 4.4 million apps available in the Apple App Store. (Statista)
As of July 2020, there were 4.37 million apps published in the Apple App Store. According to Statista, there is one gaming app available on iOS for every four non-gaming apps.
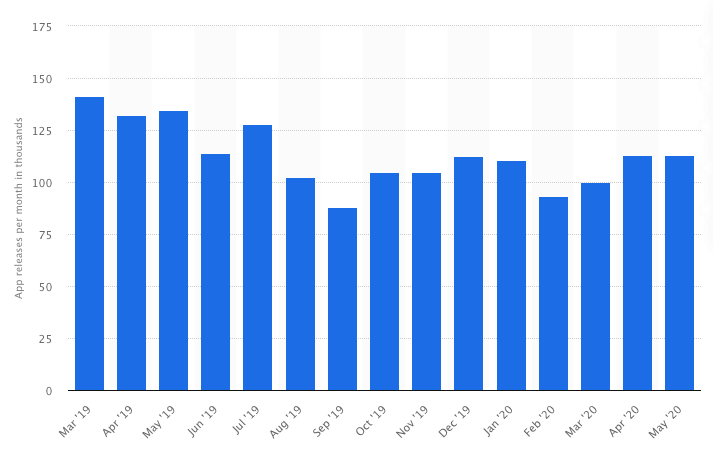
5. On average, more than 100,000 new Android apps are released in the Google Play Store every month. (Statista)
While there are fewer Android apps live on the market today, new Android apps are being published at a rate three times greater than iOS apps (see next stat), with more than 100,000 new apps being released each month.
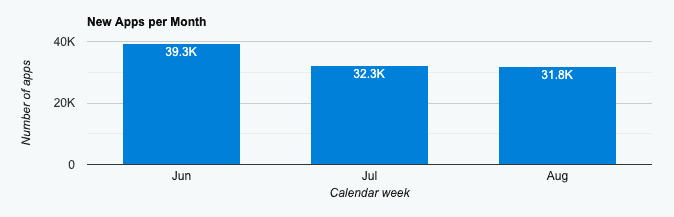
6. On average, more than 30,000 new iOS apps are released in the Apple App Store every month. (42Matters)
New iOS apps are launched at a slower rate than Android apps; this may be due to the Google Play Store reportedly being cheaper and easier to enter—and, as mentioned above, there are far more Android users than iOS users in the world. Sometimes it makes more sense to cater to the numbers, but not always. We often see businesses choosing to build for both platforms.
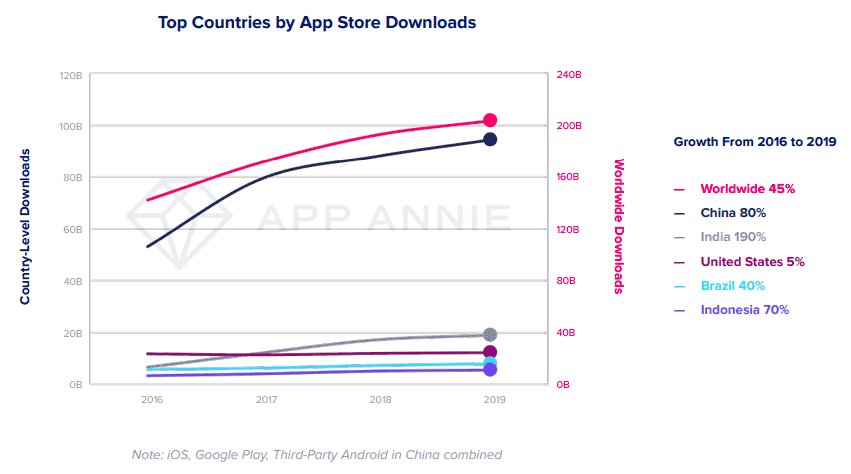
7. Consumers downloaded 204 billion apps in 2019—and that number continues to climb. (App Annie)
The number of mobile app downloads each year has been steadily increasing. In 2019, there were 204 billion app downloads worldwide (excluding re-installs and app updates). As App Annie reports, this is a 45% increase from 2016.
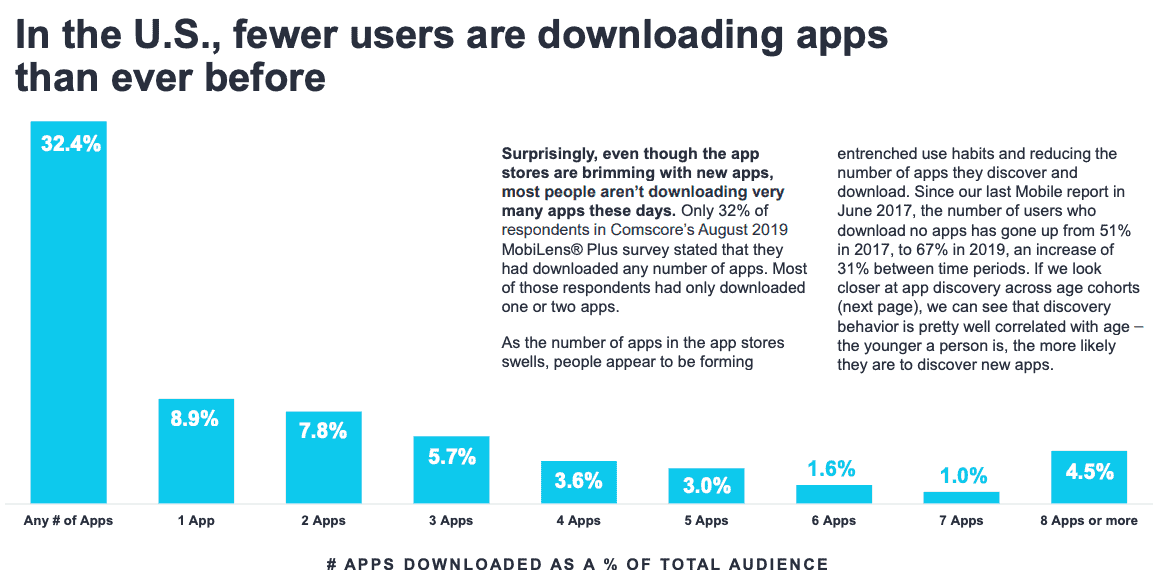
8. The average number of apps being downloaded in the U.S. is decreasing. (Comscore)
Though global download growth and the amount of time spent in mobile apps are both steadily rising, download growth in the United States is levelling off (as shown by App Annie data above). A report by Comscore further supports this trend: In one quarter of 2109, two-thirds of smartphone users in the U.S. said they downloaded an average of 0 new apps per month. The takeaway here is that unless you’re Google, you shouldn’t make an app just to make an app. Getting a user to adopt a new app or switch from a competitor is not easy—you’ve got to give them a reason to go to the app store and make that download.
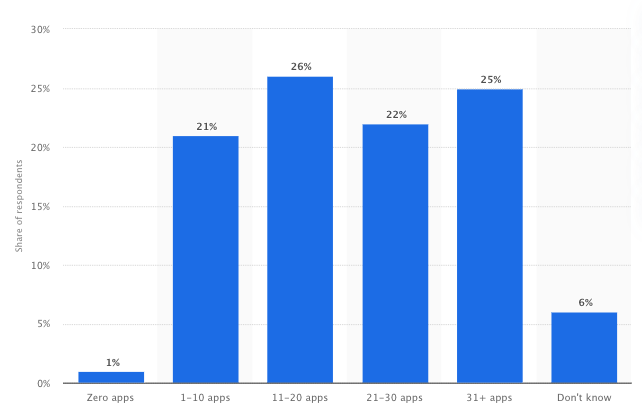
9. Most users have more than 10 apps installed on their phones. (Statista)
In a survey conducted toward the end of 2019, nearly three-fourths of respondents said that they have at least 11 apps downloaded on their phones (not including pre-installed apps). So while new apps are not downloaded very often, the average user still has a decent number of apps already vying for their attention. Downloads, however, are a pretty weak metric for success. If a user is not consistently opening and using your app, it’s essentially just there collecting dust and is at high risk of being deleted (see next stat).
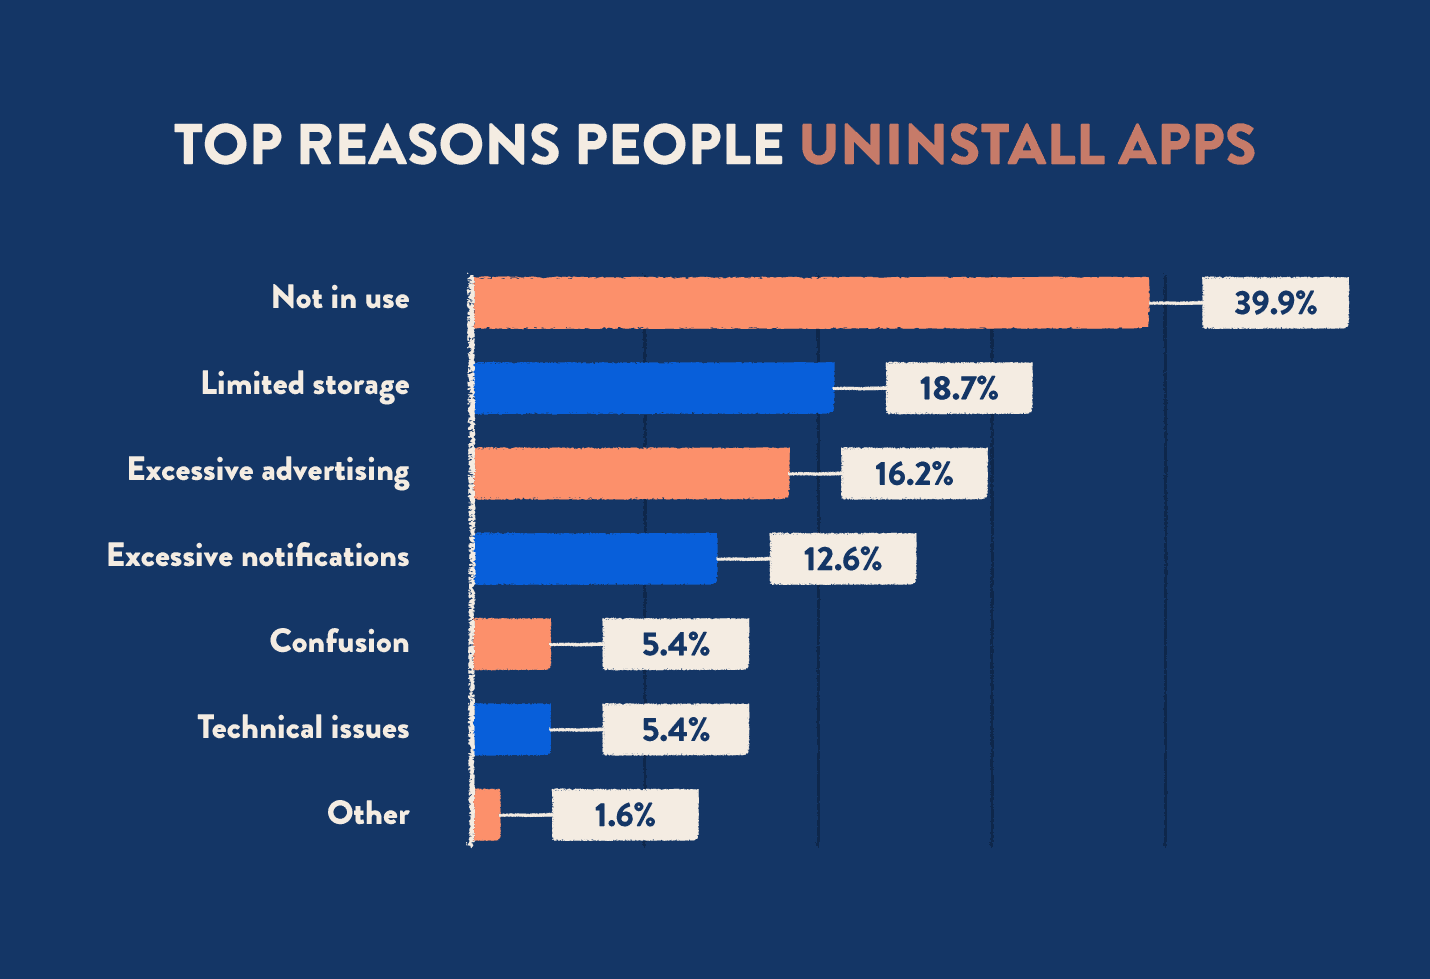
10. The number 1 reason people uninstall apps is because they aren’t in use. (CleverTap)
How often do you purge your phone of previously installed mobile apps? Many users do, primarily because those apps are not being used. The reason they aren’t being used, though, is what businesses need to focus on. Among the other top reasons for uninstalling: not enough space on their phone, excessive advertising, and excessive notifications. As CleverTap points out, all of these responses speak to one thing: a poor user experience. Functionality is everything, and poor UX can guarantee the failure of your app.
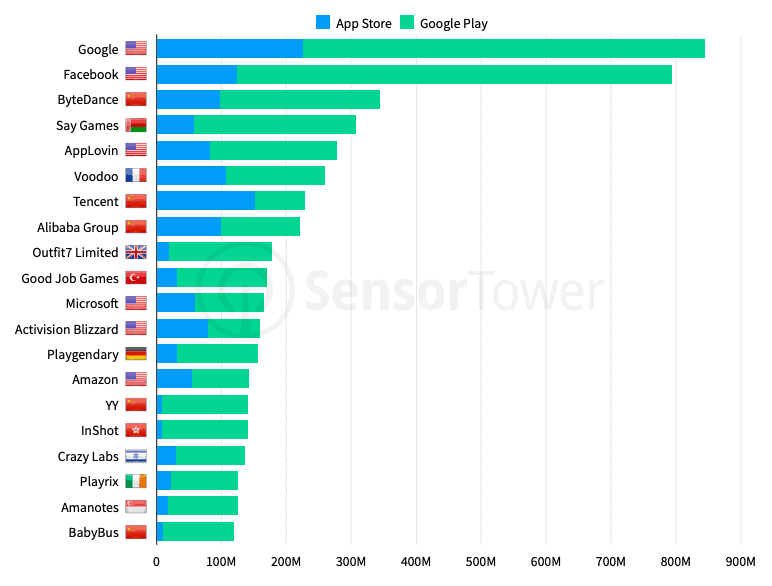
11. Google owns the majority of the mobile apps on the market today. (Sensor Tower)
With apps like Maps, Hangouts and YouTube, Google LLC owns the majority of apps published in both the Google Play Store and the Apple App Store. Google is creating apps to improve the experience of users and strengthen their connection to the brand. It’s a great business move, and you don’t have to be Alphabet to do it.
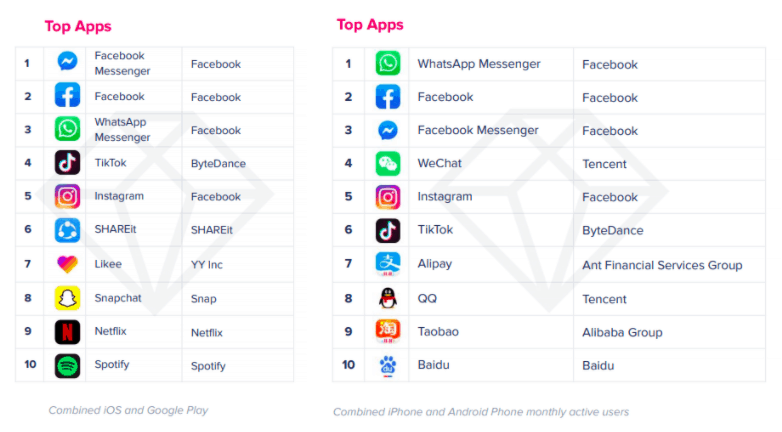
12. Facebook Messenger is the top mobile app worldwide by download, and WhatsApp is the top mobile app worldwide by monthly active users. (App Annie)
Google may own the most apps on the market, but Facebook ultimately wins with 4 out of the 5 most downloaded and most used apps. Also interesting to note is that all the apps in the top 5 are social or communication apps. This aligns with findings about the most popular app categories (more on that below).
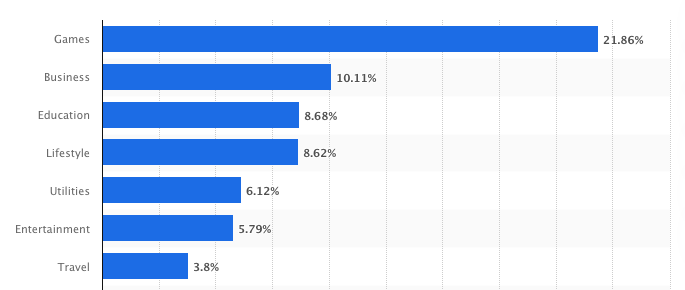
13. More than 20% of all mobile apps in the Apple App Store are game apps—2X the number of business apps. (Statista)
Of all the mobile apps in the Apple App Store, the most popular category for developers is gaming apps. Nearly 25% of all mobile apps fall into the games category. That’s two times more than the second highest category, business. If you’re looking to launch a new gaming app, be prepared for some tough competition—but also be prepared to ride the wave of a massively booming industry!
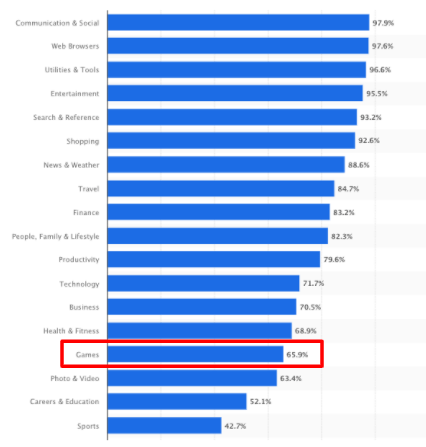
14. Only 66% of smartphone users have game apps on their phones. (Statista)
Although gaming apps are the most commonly created, only 66% of smartphone users have at least one gaming app on their device. In contrast, more than 95% of all smartphone users have a communication or social app, web browser, utility or tool app, and entertainment app. Statista does not specify whether or not pre-installed apps are included in their data.
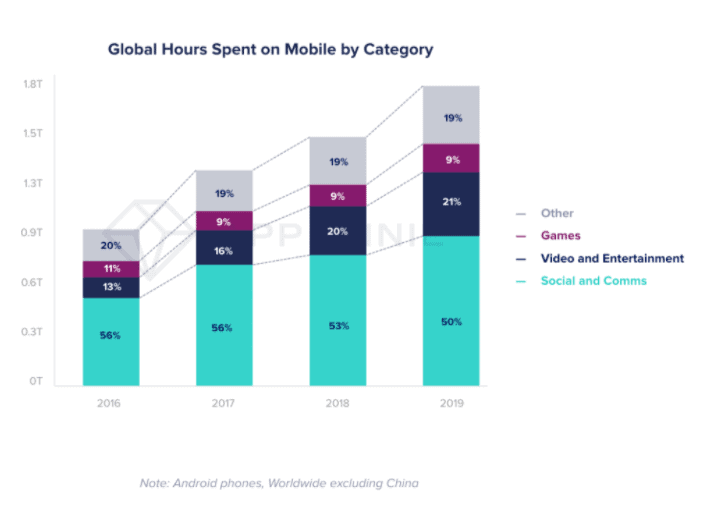
15. Smartphone users spend 50% of their mobile app time in social and communications apps. (App Annie)
Not only are social apps the most frequently downloaded, but they are also where smartphone users are spending the biggest chunk of their time (50% of total usage time, to be exact). In second place are video and entertainment apps, like Netflix and TikTok, coming in at 21% of total usage time. As App Annie reports, the lines are beginning to blur between social apps and entertainment apps as new generations turn to them for similar purposes.
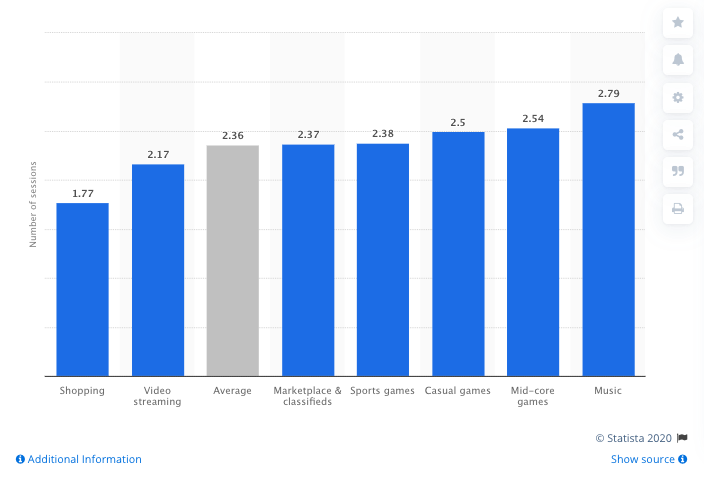
16. Music apps are launched more daily than any other category of app. (Statista)
While users spend most of their time in social and communications apps, they frequent their music apps more than any other app type—launching them nearly 3 times per day, on average. This is a little hard to believe, considering how often users seem to log into Facebook, Instagram, their texting apps, and even email, on a daily basis. We’d expect to see the social and communications app category somewhere on this chart, and since it’s not, it’s hard to fully understand this data.
Millennials & Gen Z App Usage Statistics
Millennials and gen Z are the two most tech-savvy generations with rapidly growing purchasing power. If your app targets these groups, understanding what makes them tick will help you persuade them to adopt your app.
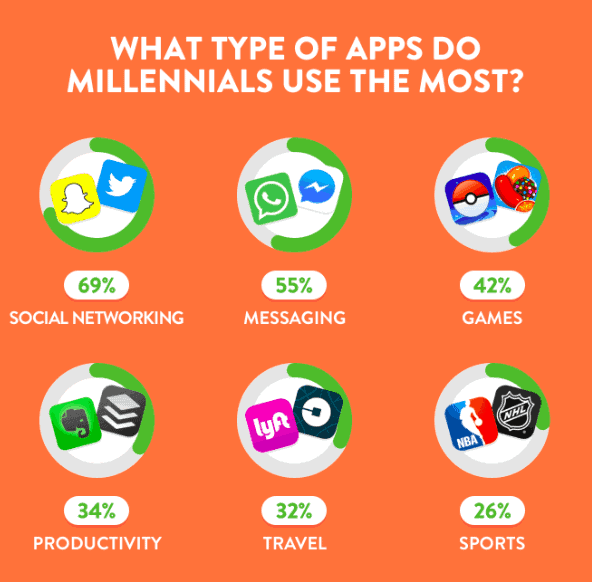
17. Nearly 70% of millennials say social networking apps are among their most commonly used. (MindSea)
Among millennials in particular, the number who list social media apps as their most frequently used category is at 69%. In second place, at 55%, is messaging apps—because again, the most popular use of apps is connecting and communicating with others. If you’re targeting this generation, consider incorporating features in your app that allow users to connect with their peers and be part of a community.
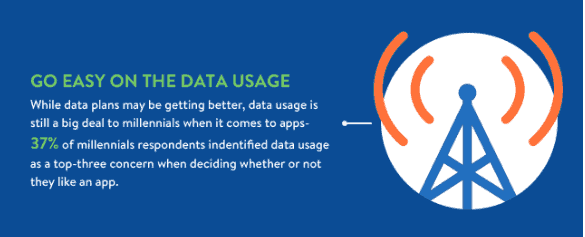
18. Roughly 37% of millennials list data usage as a key factor when deciding if they like a mobile app. (MindSea)
When asked about the top factors when deciding if they’ll keep a mobile app, 37% of millennials said excessive data usage was a dealbreaker for them. A perfect example of this is Pokémon Go—when it first launched, the app quickly became a viral hit, but users were constantly frustrated with how much data it ate up, and many deleted it. As you’re building your own mobile app, keep in mind that high data usage may result in users hitting the delete button fast.
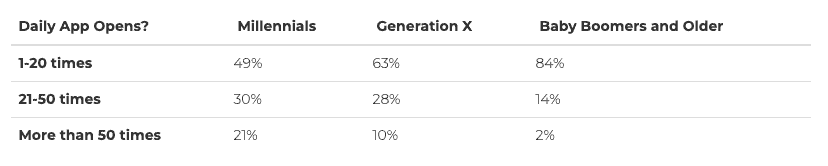
19. 21% of millennials say they open their apps more than 50 times per day. (The Manifest)
On a daily basis, millennials open their mobile apps more than any generation prior. Are you one of them? It’s nearly noon and I’ve already opened four social apps, three communication apps, a weather app, my email app and the calculator app—and many of them have been opened more than once. It’s not that hard to get to 50! Younger generations today are tech savvy and always on their phones. Build a great app, build their trust and loyalty, and they will come back time and again.
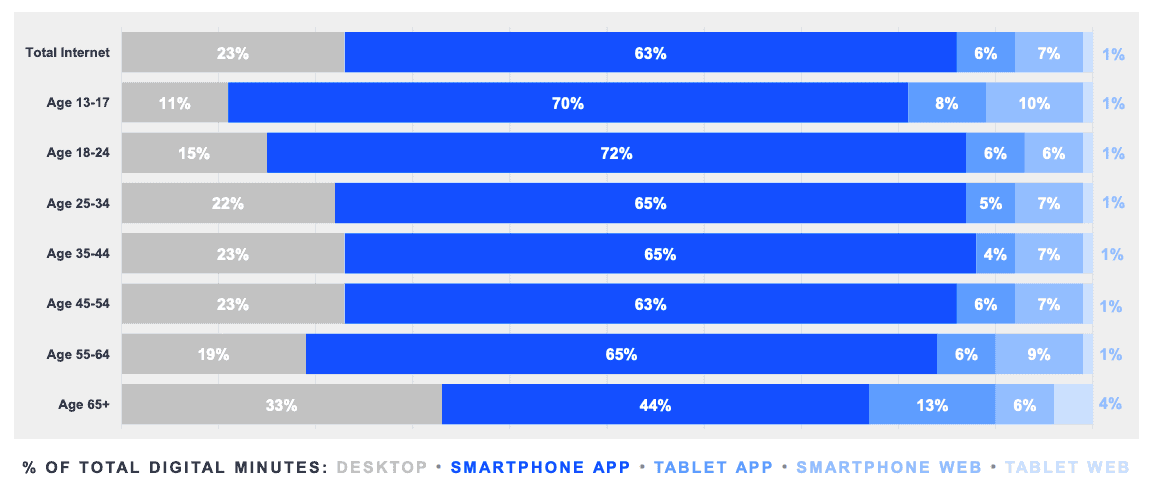
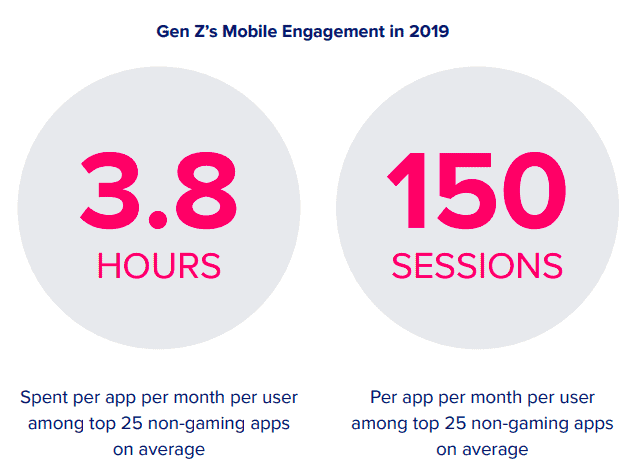
20. Gen Z spends 71% of their digital media time using smartphone apps. (ComScore)
As ComScore points out, smartphone users between the ages of 13 and 24 are the heaviest mobile app users. This is supported by App Annie data, which shows that gen Z holds the crown for total number of sessions and total time spent per month in top, non-gaming mobile apps. As App Annie also points out, gen Z is set to soon surpass millennials as the largest generation, so if your target audience falls in this age group, this is good news for you.
Mobile App Revenue Statistics
Lastly, we round out this piece with some insights on mobile app revenue. If you’re looking to monetize your app, here’s what you need to know…
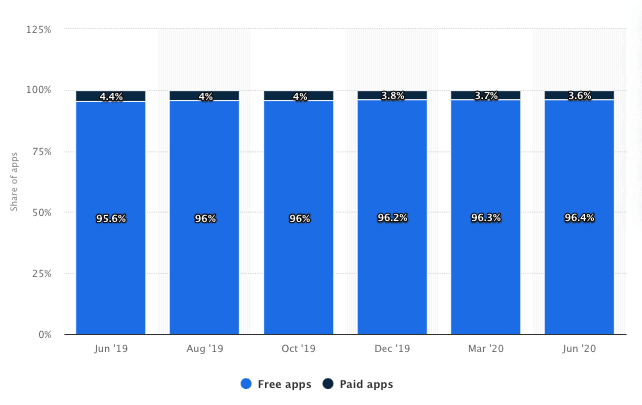
21. 92% of apps in the Apple App Store are free. (Statista)
Free apps dominate the market. Among app pricing strategies, the free and freemium models appear to be the ones that have consistently worked the best across app categories, given their increasing popularity. Many of these apps still making money thanks to ads, add-ons and upgrades.
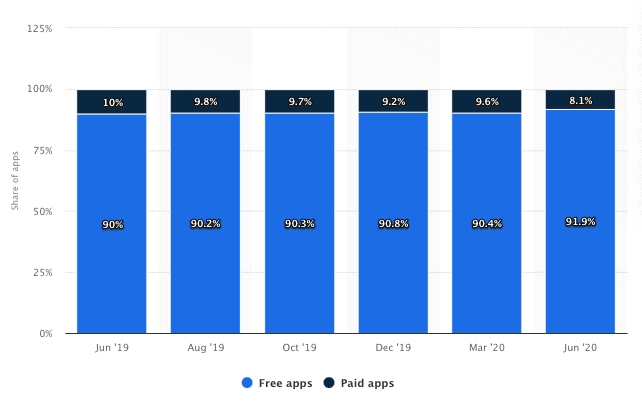
22. 96% of apps in the Google Play Store are free. (Statista)
The majority of apps in the Google Play store are also free, and a higher percentage than those in the App Store.
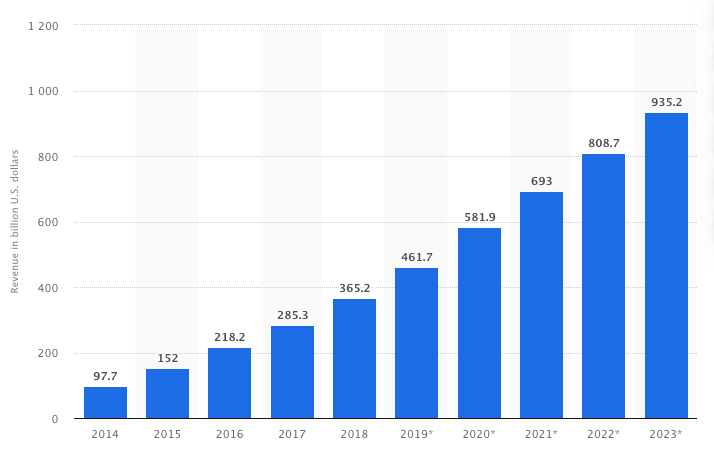
23. Mobile apps are projected to hit $581.9 billion in revenue in 2020. (Statista)
In case you had any doubts, the mobile app market is hot. App revenue has risen tremendously over the past decade; this growth is forecasted to continue, with revenue projected to hit nearly $1 trillion in 2023. It’s not too late to get in on the action!
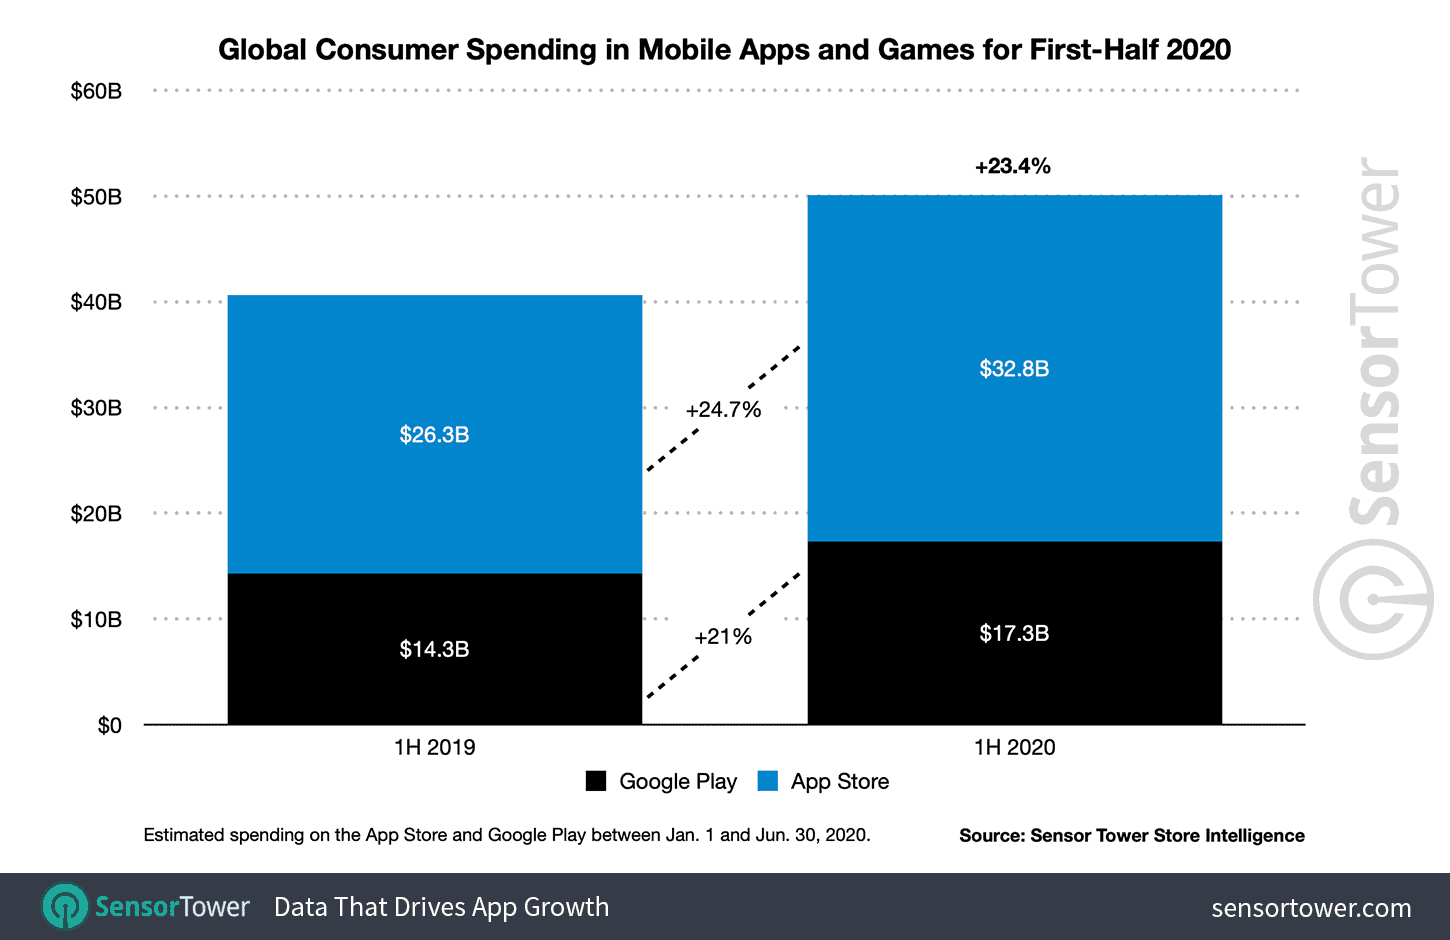
24. Apps in the Apple App Store bring in nearly double the revenue of those in the Google Play Store. (Sensor Tower)
If maximizing revenue is a priority for your mobile app, you may want to launch in the Apple App Store. Sensor Tower reports that iOS apps consistently bring in more money than Android apps. Remember, there are nearly two times the amount of apps in the App Stores and one fifth of those are gaming apps. These figures are likely contributing to Apple’s leg up in the revenue department.
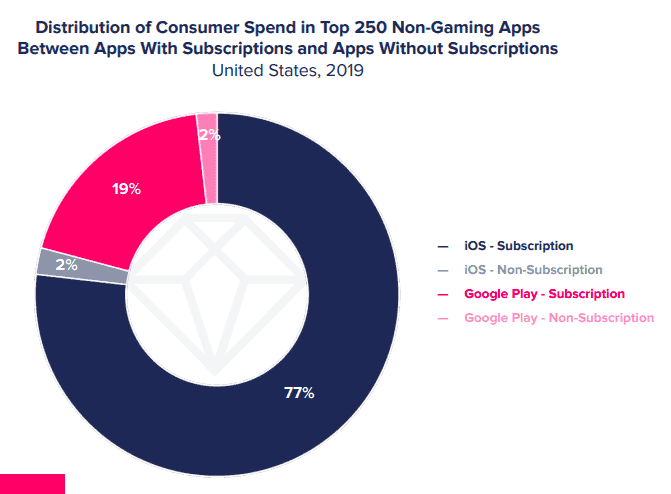
25. Apps with subscriptions account for the majority of consumer spend in top non-gaming apps. (App Annie)
In the U.S., subscriptions contribute the most to growing mobile revenue numbers. App Annie reports that in 2019, 97% of consumer spend in the top 250 non-gaming apps in the Apple App Store was driven by subscriptions. In the Google Play Store, subscription-based revenue came in at 91%.
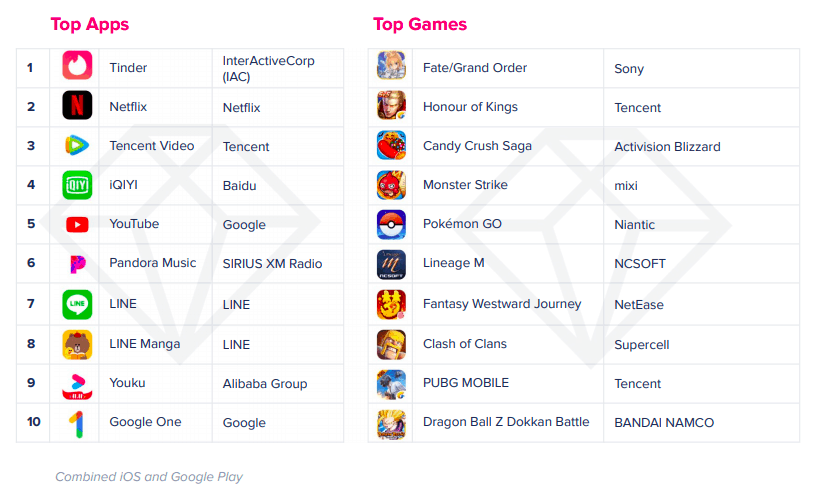
26. Consumers spend the most on video apps. (App Annie)
Four out of the top five non-gaming apps for 2019 based on worldwide consumer spend were video apps. Video has been a growing content format for years now, and it’s not going away. It is also a popular type of content for subscriptions, so video apps drive a big chunk of mobile revenue. The fact is, in and outside of apps, video content is rising in use and popularity across industries; including some elements of audio, video and or animations in your app wouldn’t be a bad idea.
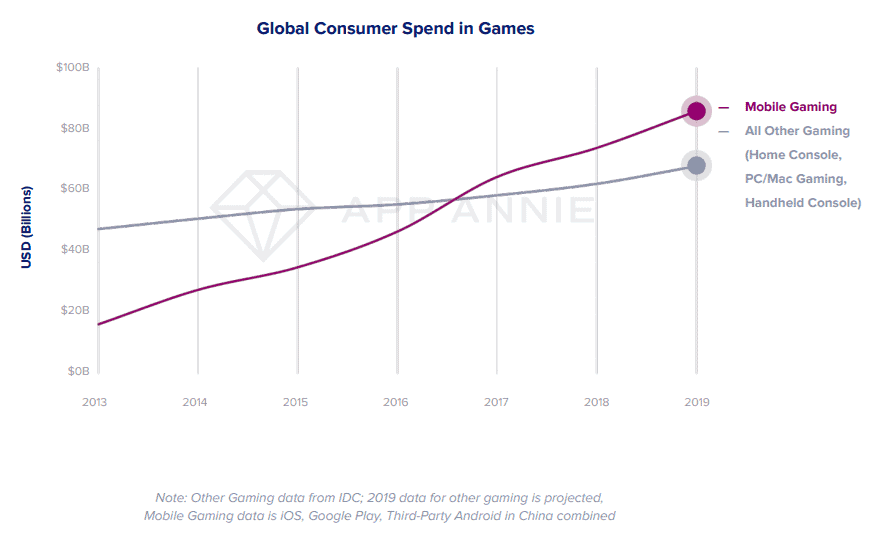
27. Mobile gaming is projected to surpass $100 billion in consumer spend in 2020. (App Annie)
The year that mobile gaming took off… According to App Annie data, in 2019 consumers spent 25% more on mobile games than all other gaming combined. Spend was projected to surpass $100 billion in 2020, but that number may end up even higher now with the additional boost mobile gaming has received from stay-at-home orders. You can read more about the impact of COVID-19 on gaming in App Annie’s 2020 gaming spotlight review.
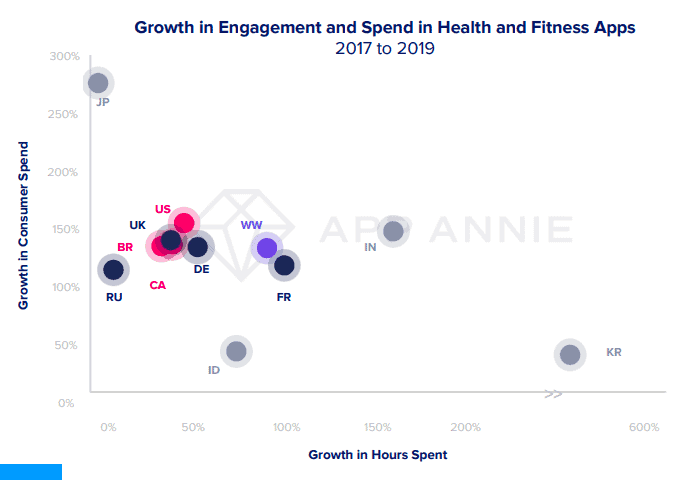
28. Consumers spent 130% more in health and fitness apps in 2019 than they did in 2017. (App Annie)
Exercising is another at-home activity that more consumers have been exploring since the pandemic forced the closure of gyms, sporting fields and rec centres. According to Sensor Tower, health and fitness app downloads are up 47% year-over-year, and per App Annie, consumer spend last year was already up 130% from 2017. That’s right: In 2019, consumers worldwide spent a total of $1.5 billion in this category, so if health and wellness is the market you’re in, now is the time to build your app!
Now It’s Your Turn
Hopefully this post has helped you think a bit more critically about the direction you’re taking your own mobile app. Understanding what your audience is actually doing can unlock the difference between a mobile app that completely misses the mark and one that’s wildly successful.
Looking for a partner to help you drive business value with a strong mobile strategy? We’d love to chat. Take a minute to schedule a free call with one of our mobile product strategists today!
Now we want to hear your take:
Which mobile app usage stat was the most surprising to you?
Is it that smartphone users spend 90% of their mobile time in apps?
Or maybe that the App Store brings in double the revenue of Google Play.
Hit us up on Twitter and let us know.