By 2027, mobile apps are projected to generate over $673 billion in revenue. That’s impressive. Have you ever wondered what drives someone to use (or not use) a mobile app? Or what type of mobile app they’re likely to use the most? Or how much time they’re spending in the mobile apps they download?
In this post, we’ve gathered 24 of the most up-to-date mobile app usage and download stats, facts and projections you can use to make sure your own app aligns with what your target audience is actually doing in 2024 and beyond. We’ve pulled research from the likes of Sensor Tower, Statista, 42Matters and more to bring you the numbers and insights that matter most.
Let’s get right to it (or skip to a section below).
Mobile App Usage & Download Statistics
Get the Ultimate Guide to Digital Health App Design and Development
Unlock the best strategies, tips, and tricks we’ve discovered from 17+ years of digital product development.
Mobile App Usage & Download Statistics
We kick things off with stats about usage trends and download habits. These numbers highlight what’s going on in the mobile app market today and even speak to the psychology of mobile users.
1. Overall, 5.3 trillion hours were spent using mobile apps during 2025.
Sensor Tower found that the average person spent 3.6 hours a day on their mobile phone last year—up 3.8% from 2024. Google, YouTube, and Google Chrome are on the top apps with the most active users every month.

2. Mobile internet usage is rising while desktop internet usage continues to fall.
Since 2016, when mobile traffic surpassed desktop, that difference has only grown. In 2025 the mobile traffic consisted of 60.5% while desktop only traffic was only 39.5%.

3. Users spend 4.2 times more in mobile apps than mobile browsing
The gap between mobile app usage and mobile browser usage is also widening. eMarketer predicted that in 2024 users would spend 80% of that time in mobile apps. But now Electroiq estimates that this number actually was 90%. This speaks to the importance of companies not only optimizing their websites for mobile, but creating custom, responsive apps too. Mobile apps load 2–3x faster than mobile websites because they can store data on the device.

4. There are 2.19 million apps available in the Google Play Store.
The amount of available apps seems to have plateaued at about 2 million on both major app stores. Older sources had predicted 3.5 million apps for Google Play. These references are now considered outdated because Google removed millions of legacy apps to improve search quality in late 2024 and 2025. Modern references (2025+) reflect this smaller, higher-quality catalog.

5. There are 2.1 million apps available in the Apple App Store.
While the overall number of apps on both platforms has been subject to year-over-year reduction due to stricter review processes for older apps (focusing on security and privacy), the industry is not slowing down. A constant influx of new apps being published every month demonstrates sustained innovation in the mobile sector, as we can see in the next stat.

6. Around 120k apps are released across both the Google Play Store and Apple App Store each month.
42matters (App Store) 42matters (Google Play)
The Apple App Store saw approximately 557,000 new apps in 2025, a 24% increase from the previous year. As for Google Play Store, new developer requirements and aggressive removals of “low-utility” apps have caused monthly releases to plunge by nearly 75% since 2022.

7. On average, about 2,113 new iOS apps are released in the Apple App Store every day. And 1,717 new Android apps are released in the Google Play Store every day.
42matters (App Store) 42matters (Google Play)
Publishing activity in 2025 and early 2026 shows that the roles have reversed between the two major platforms. While the Google Play Store was historically the volume leader, stricter quality policies have slowed its new releases.

8. Users have an average of 80 apps installed on their phones in 2025.
The average number of apps installed on a mobile phone was 80 in 2025. However, looking closer at the definition of an “installed app” can show a slightly different picture. Installed apps often include system offloaded applications or pre-installed software (ghost apps).
According to Raas Cloud, while users have over 80 apps on average, roughly 62% of those go unused in any given month. Despite having many options, the vast majority of a user’s time (up to 90%) is spent in a select few key categories: Social Media, Communication, and Entertainment.

Get the Ultimate Guide to Digital Health App Design and Development
Unlock the best strategies, tips, and tricks we’ve discovered from 17+ years of digital product development.
9. Technical Performance and Storage Management are among the main reasons why users uninstall apps.
Dot Com Infoway This Is Glance
Understanding why users uninstall apps is crucial for retention. While no single reason is universally impactful, Technical Performance and Storage Management consistently remain the main motives for deletion. Users have grown less tolerant of friction and technical problems.
- It is estimated that 53% of people uninstall apps due to Technical Performance. An app taking longer than 3 seconds to load or respond is often considered slow enough to warrant an uninstall.
- In terms of storage, apps that store a large amount of data without a clear function to free up space are often the first to be removed.
10. The most popular Apple App Store category is utilities, making up nearly 13% of all available apps.
In the past years we saw business app closing the gap in the number of available apps in the Apple App Store. With the advance of AI, a huge portion of the 2024-2025 “Gold Rush” involved developers launching hundreds of slight variations of AI writing or scheduling tools. We now have Utilities and Business with more apps available in the Apple App Store.
Games are still the most relevant in terms of revenue. Being responsible for 60% of total App Store revenue ($82 billion+).

11. Gaming is the category with the most downloads across Apple App Store and Google Play Store.
Followed by Entertainment, Finance, and Productivity; Games showed 35.54 Billion downloads in both stores. With 30% of all downloads, Games is the most “saturated” category, with over 5,500 new apps launched daily.

12. Smartphone users spend 35% of their mobile app time in social media apps.
Not only are social media apps the most frequently downloaded, but they are also where smartphone users are spending the biggest chunk of their time. In second place are entertainment apps, like TikTok and Netflix, coming in at 32.7% of total usage time. The lines are beginning to blur between social apps and entertainment apps as new generations turn to them for similar purposes.

Millennials & Gen Z App Usage Statistics
Millennials and gen Z are the two most ech-savvy generations with rapidly growing purchasing power. If your app targets these groups, understanding what makes them tick will help you persuade them to adopt your app.
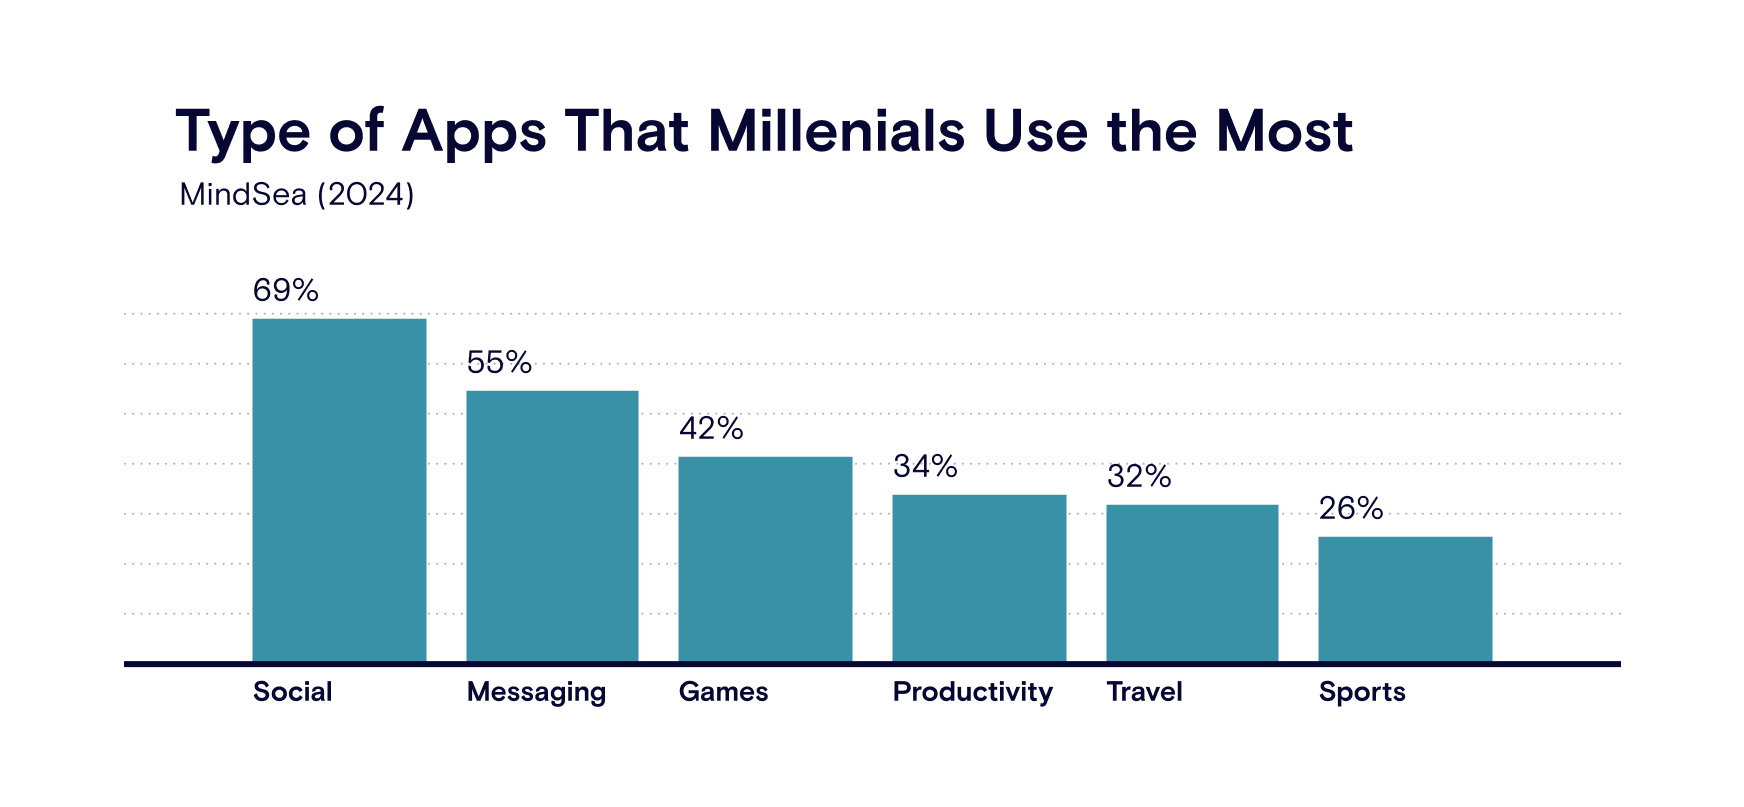
13. Nearly 70% of millennials say social networking apps are among their most commonly used.
Among millennials in particular, the number who list social media apps as their most frequently used category is at 69%. In second place, at 55%, is messaging apps—because again, the most popular use of apps is connecting and communicating with others. If you’re targeting this generation, consider incorporating features in your app that allow users to connect with their peers and be part of a community.
14. Gen-Z users engage 20% more than older groups in non-gaming apps.
The group age that is more active on their phones is 25–34. They dominate almost 50% of the usage of Dating and Social discovery apps. Shopping, Sports, and Travel attract older users (35–44) and Generative AI users lean more towards younger people.

Mobile App Revenue Statistics
Lastly, we round out this piece with some insights on mobile app revenue. If you’re looking to monetize your app, here’s what you need to know…
15. AI apps usage has tripled in 2025
AI stepped up from a technology that people test to something that is baked in their daily lives. Users spent 48 billion hours in AI Generative apps in 2025. This shows that AI tech is still booming and while there is great competition in the industry there is a lot of user interest in it.

16. 95.4% of apps are free.
Free apps dominate the market. 97% of Google Play apps are free and 95% of apps in the Apple Store are available at no cost. Among app pricing strategies, the free and freemium models appear to be the ones that have consistently worked the best across app categories, given their increasing popularity. Many of these apps are still making money thanks to ads, add-ons and upgrades.

17. Apps in the Apple App Store bring in more than double the revenue of those in the Google Play Store.
If maximizing revenue is a priority for your mobile app, you may want to launch in the Apple App Store. iOS apps consistently bring in more money than Android apps. Remember, there are more than twice as many apps in the Apple App Store as in the Google Play Store. These figures are likely contributing to Apple’s leg up in the revenue department.

18. Gaming apps are projected to generate up to $230 billion in revenue by 2030.
The trend in mobile gaming stays true to previous projections and it is still steadily climbing. 2024 Statista’s projection expected that in 2029 the market would increase to $132 billion. Newer data shows that this forecast is from $165-$230 billion by 2030 according to UndrAds. There are many examples of the benefits of gaming and how gamification is changing mHealth for the better.

Get the Ultimate Guide to Digital Health App Design and Development
Unlock the best strategies, tips, and tricks we’ve discovered from 17+ years of digital product development.
19. Subscriptions account for 95% of all revenue generated mobile apps.
The largest amount of App Revenue comes from Subscriptions. Subscriptions are responsible for 97.5% of the revenue in Apple’s App Store while in Google Play Store it accounts for 84.2% of their share of the market. And while it seems that customers are more willing to spend their money on subscriptions there are a few things to watch if you are considering using this business model. Convincing users to join a subscription on a free app is one of the most costly conversions to make. And once that happens retention is another challenge with users.

20. Health and Wellness apps generated a total revenue of $4.62 billion in 2024.
Business of Apps Health Business of Apps Wellness Apps
Health and fitness apps saw strong growth in consumer spending in 2024. Data shows that despite another year of decline in Wellness apps, Health apps revenue keeps growing constantly. My Fitness Pal leads the Health market share with 45% of revenue and Calm leads the Wellness space with 36% of the revenue. If health and wellness is the market you’re in, now is the time to build your app!


Get the Ultimate Guide to Digital Health App Design and Development
Unlock the best strategies, tips, and tricks we’ve discovered from 17+ years of digital product development.